
1. Why Care About the GPU?
The Graphics Processing Unit (GPU) acts as the primary ‘painter’ in our game, responsible for rendering each frame with full visual fidelity. As visual standards in Unreal Engine 5 escalate with features like Nanite and Lumen, the computational demands on the GPU grow exponentially. When a project is GPU-bound, the time taken to process draw calls or rasterize geometry exceeds the frame budget (e.g., 16.6ms for 60fps), leading to performance delays and a diminished player experience.
2. Diagnosing Bottlenecks
Before attempting optimization, you must confirm that the GPU is indeed the bottleneck. Open the developer console during gameplay (typically the ~ key) and type stat unit. This displays real-time metrics for Game (CPU), Draw (CPU preparation), and GPU. If the GPU metric is consistently the highest, your application is GPU-bound.
For a hierarchical snapshot of the current frame, use the ProfileGPU command (Ctrl+Shift+.). This tool provides a breakdown of costs for specific passes, such as lighting, post-processing, and base passes, allowing you to identify which part of the pipeline requires the most attention.
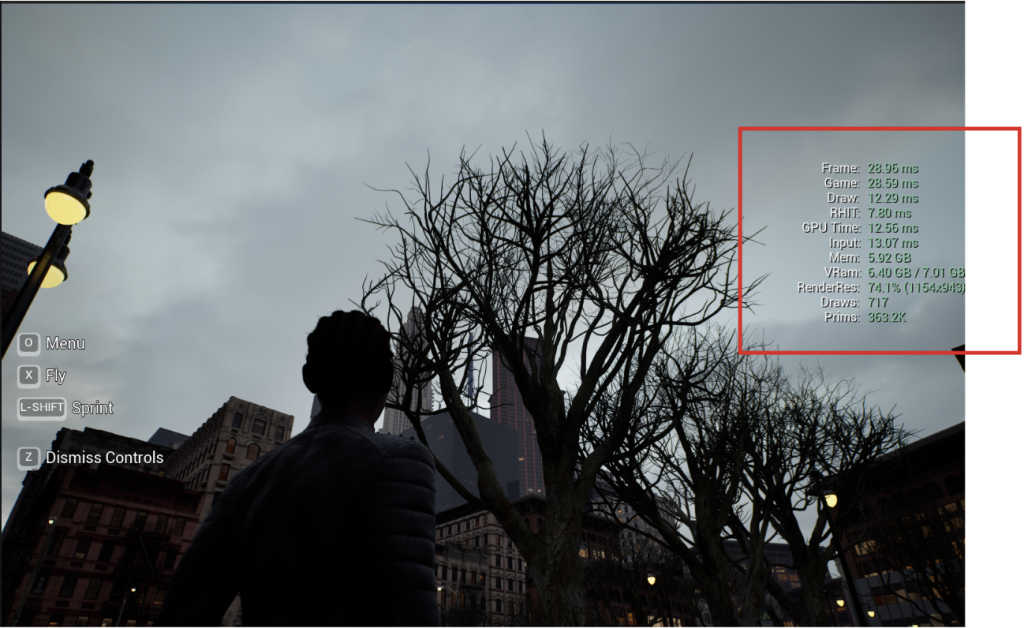
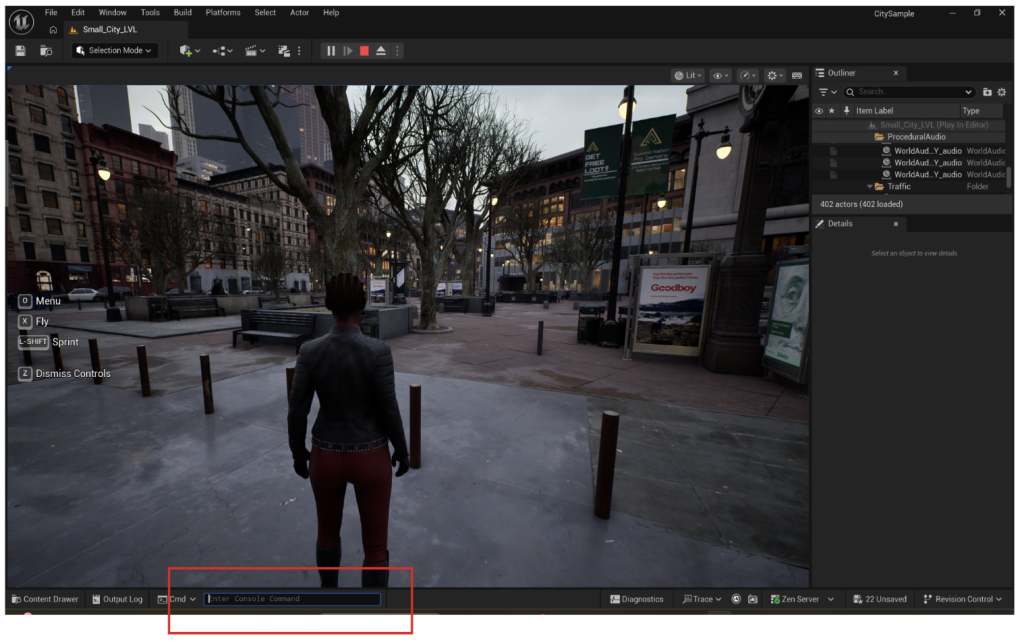
Use the console to type stat UNIT or ProfileGPU if shortcuts do not work
3. RenderDoc: The Magnifying Glass
RenderDoc serves as a high-precision graphics debugger, intercepting every API call to the Graphics Card. Instead of looking at abstracted data, you can view each dispatched draw call or triggered event in explicit detail. This makes it an essential tool for deep-dive analysis once a general bottleneck has been identified.
How to Use RenderDoc in Unreal Engine
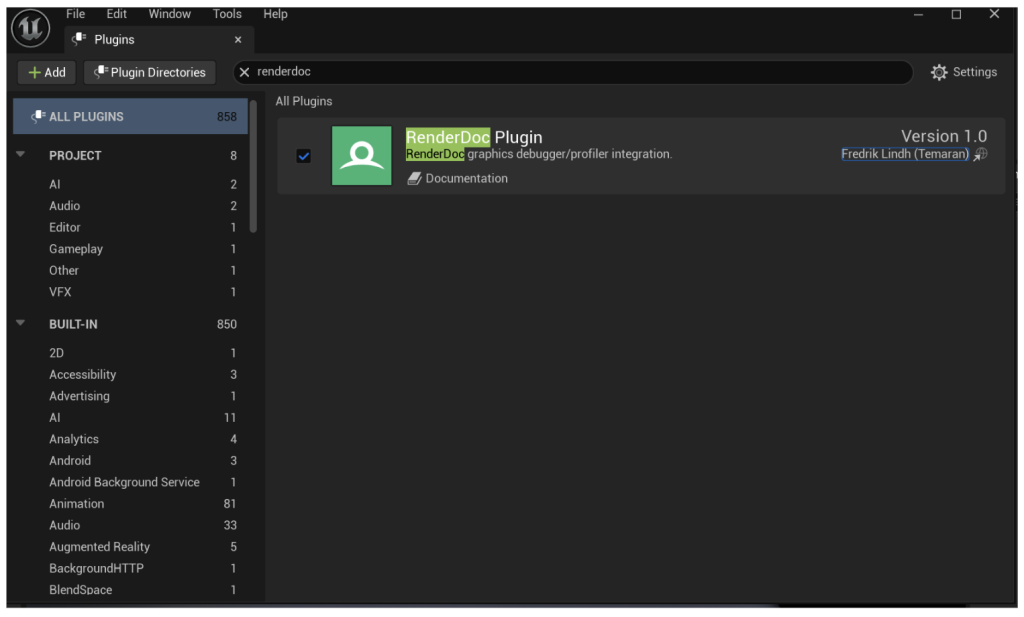
- Enable the Plugin: In Unreal Engine, navigate to Edit > Plugins and search for “RenderDoc”. Ensure it is enabled and restart the editor if necessary.
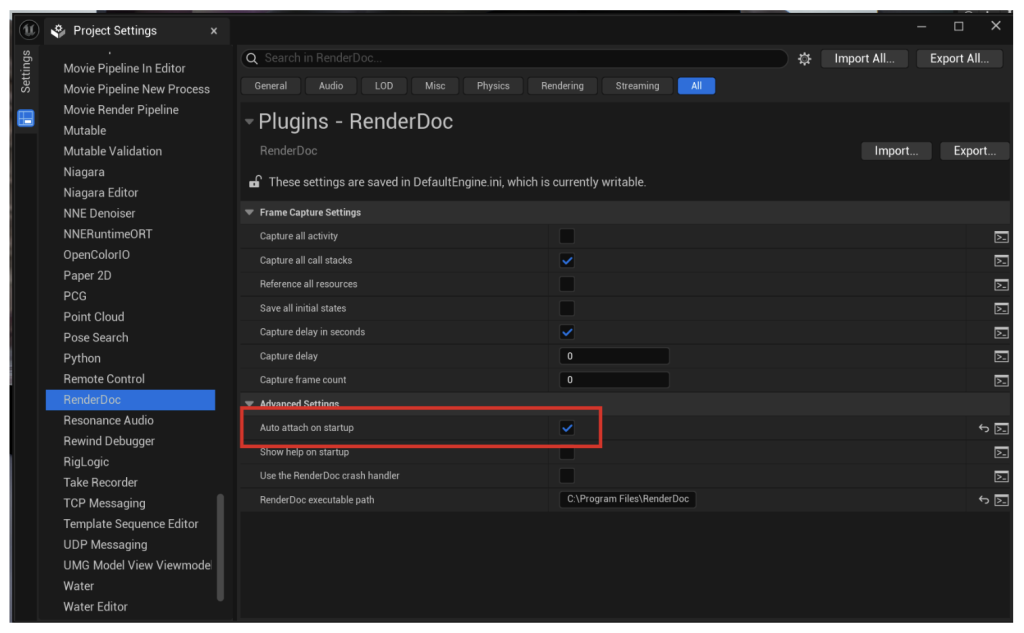
- Attach on Startup : Set Attach on startup in Edit > Project Settings > RenderDoc
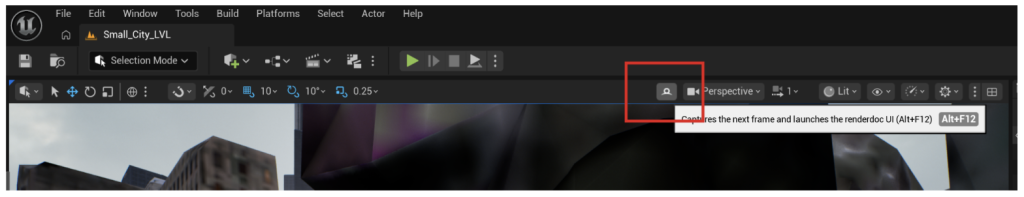
- Capture the Frame: Position your viewport camera at the specific scene causing performance issues. Click the RenderDoc Capture button in the upper-right corner of the Level Viewport.
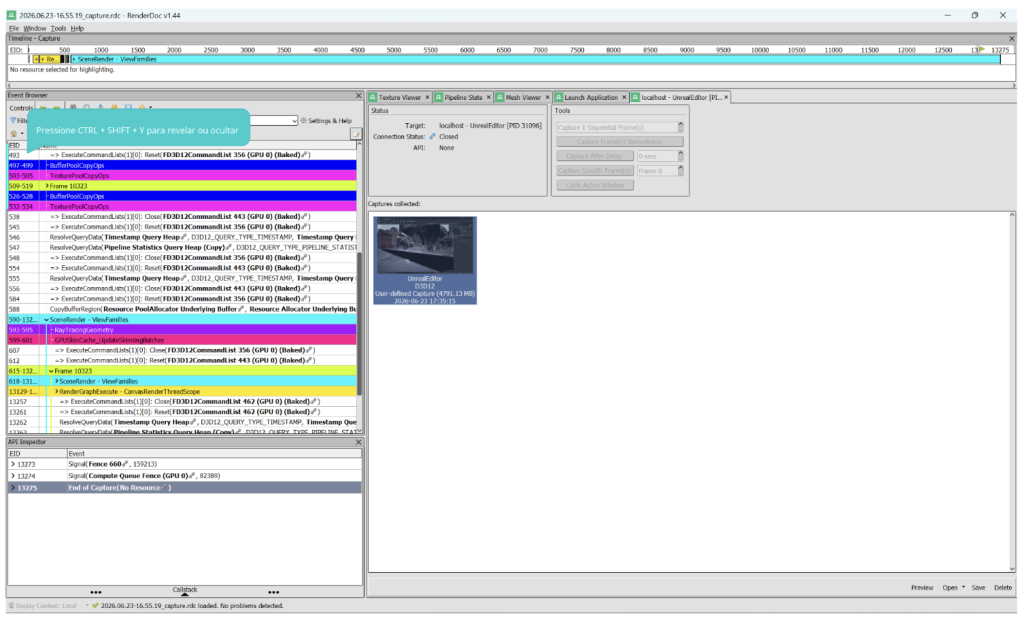
- Analyze Content: Open the standalone RenderDoc application (available at RenderDoc.org) and load your capture file to begin inspecting the graphics pipeline state and shader code.
4. Frame by Frame Data
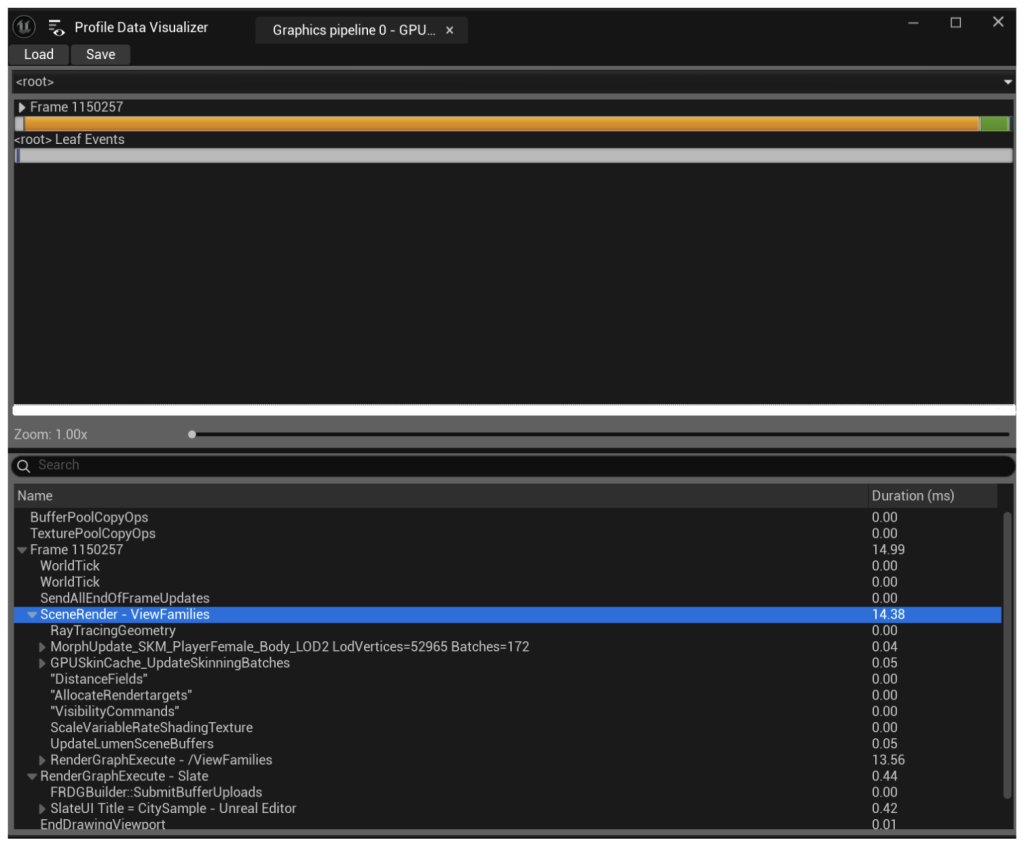
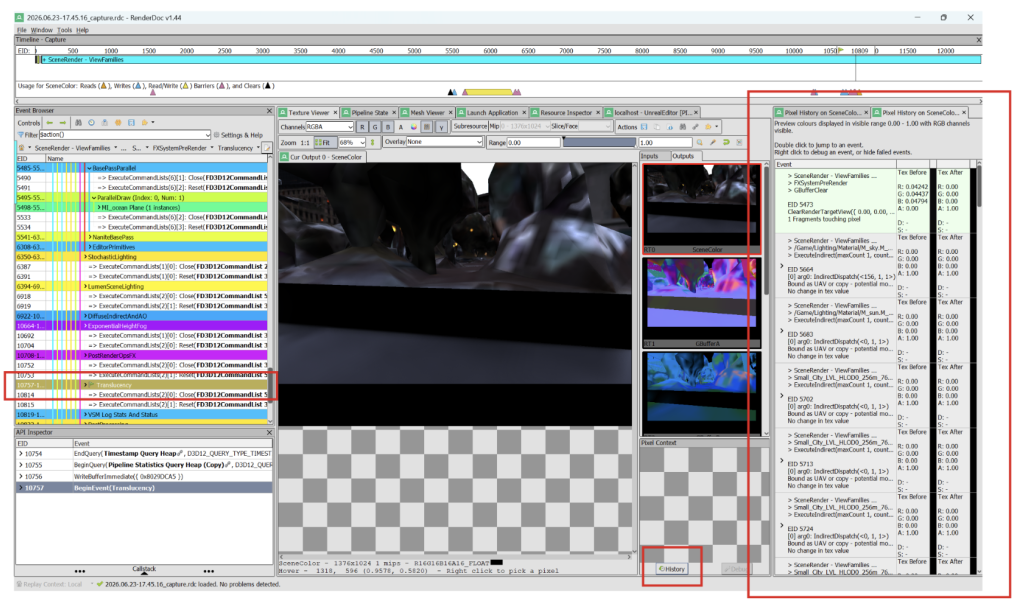
Once you’ve captured that frame, RenderDoc presents you with a massive amount of technical data. It can be overwhelming at first, but you really only need to focus on a few key panels to start making sense of it.
This is a breakdown of where to look and what to look for:
- The Event Browser (The Timeline): Think of this as the “Script” for your frame. It lists every single command the engine sent to the GPU in chronological order. If your frame takes 20ms, you can scroll through this list and see exactly which Draw Call or Dispatch command is taking the longest.
- Extra Tip: Watch the “Time” column here. If you see a specific pass (like “Base Pass” or “Shadow Depth”) suddenly jump in duration, that’s your smoking gun.
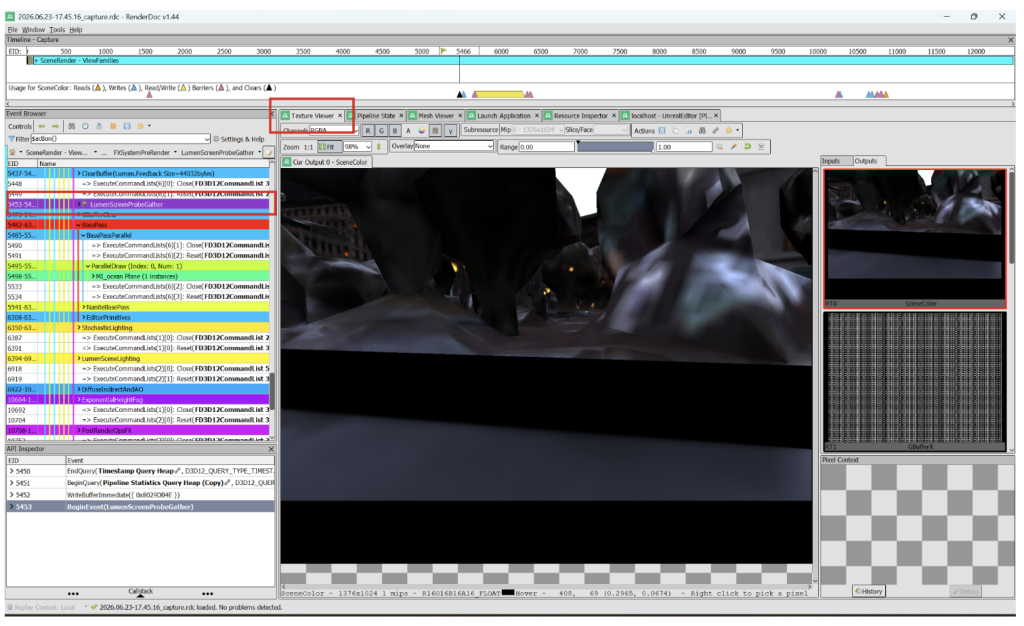
- The Texture Viewer (The Inspector): This is where you see what the GPU is actually looking at. You can inspect every texture currently bound to the graphics card.
- Why it matters: This is the best place to check if your textures are mipmapping correctly or if you are accidentally using massive 8K textures for a prop that’s only seen from a distance.
- The Pipeline State (The Hardware Settings): This panel shows the “ingredients” for the currently selected Draw Call—the shaders, the blending modes, and the rasterizer state.
- Why it matters: If a specific object is rendering incorrectly (or not at all), this panel tells you exactly which shader is responsible. You can even click the shader links to open and inspect the actual code being executed on the GPU.
- Pixel History (The Forensic Tool): This is your most powerful weapon against overdraw. If you see a “hot” spot in your scene, you can click on a single pixel in the Texture Viewer. RenderDoc will show you a list of every single draw call that is written to that specific pixel.
- Why it matters: If you see the same pixel being drawn 10+ times, you’ve found a classic “overdraw” bottleneck, usually caused by stacked transparent materials or complex particle effects.
5. Unreal Engine 5 GPU Optimization Strategies
5.1 Overdraw Mitigation and Pixel Shader Efficiency
Overdraw occurs when a single screen pixel is processed and drawn multiple times within a single frame. This typically happens when translucent layers (such as UI, fire, smoke, and particles) stack on top of each other, or when dense geometry creates high sub-pixel complexity. This causes a fragment shader bottleneck, wasting GPU cycles on pixels that are ultimately hidden.
Overdraw Mitigation
To combat overdraw inside Unreal Engine:
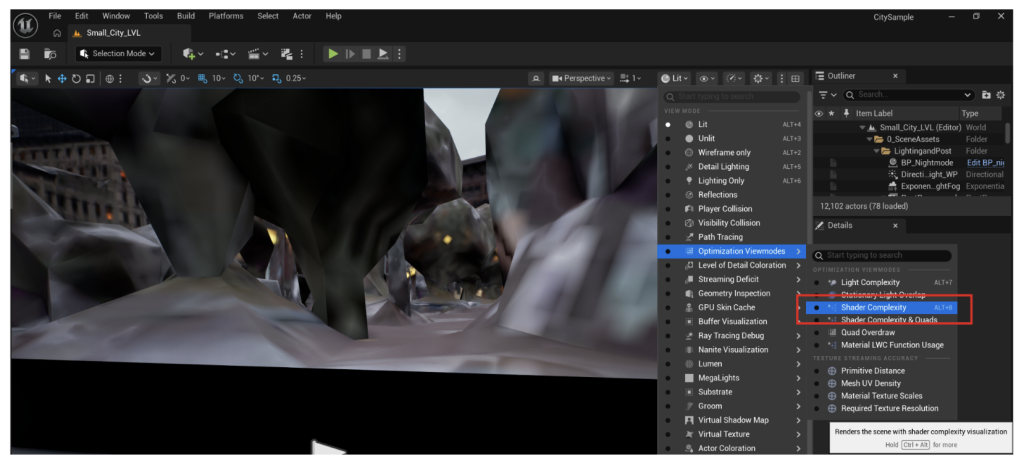
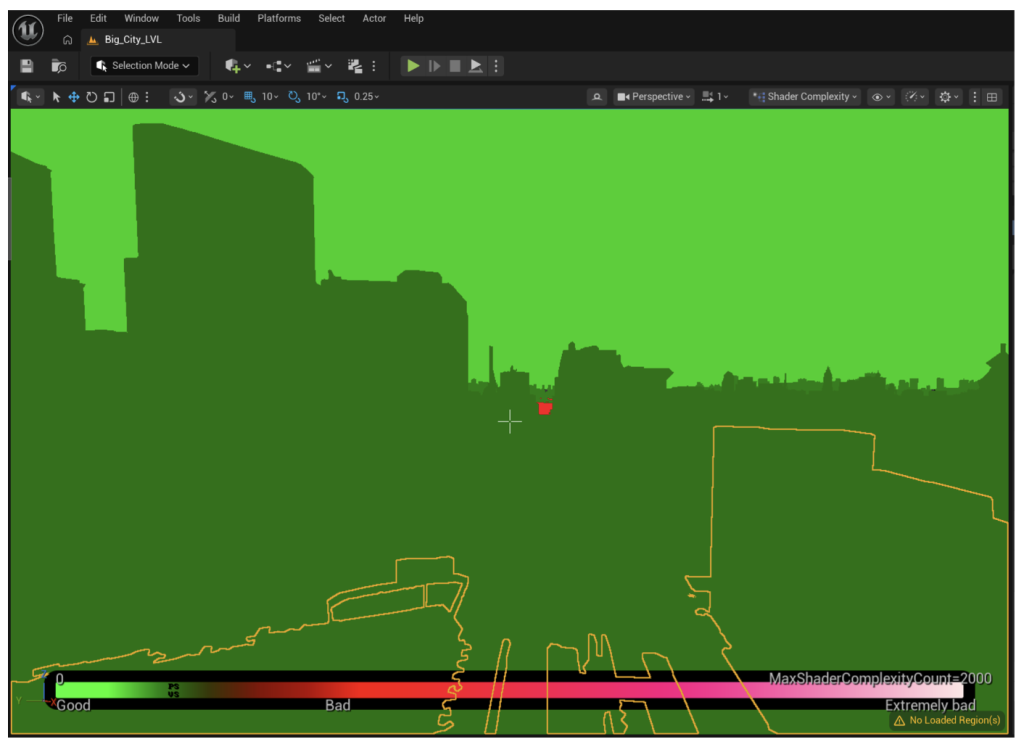
- Navigate to the Viewport View Mode menu and select Shader Complexity. Areas appearing bright green to red indicate high overdraw. Additionally, enable Quad Overdraw to see where the GPU is processing multiple pixels for a single screen area unnecessarily.
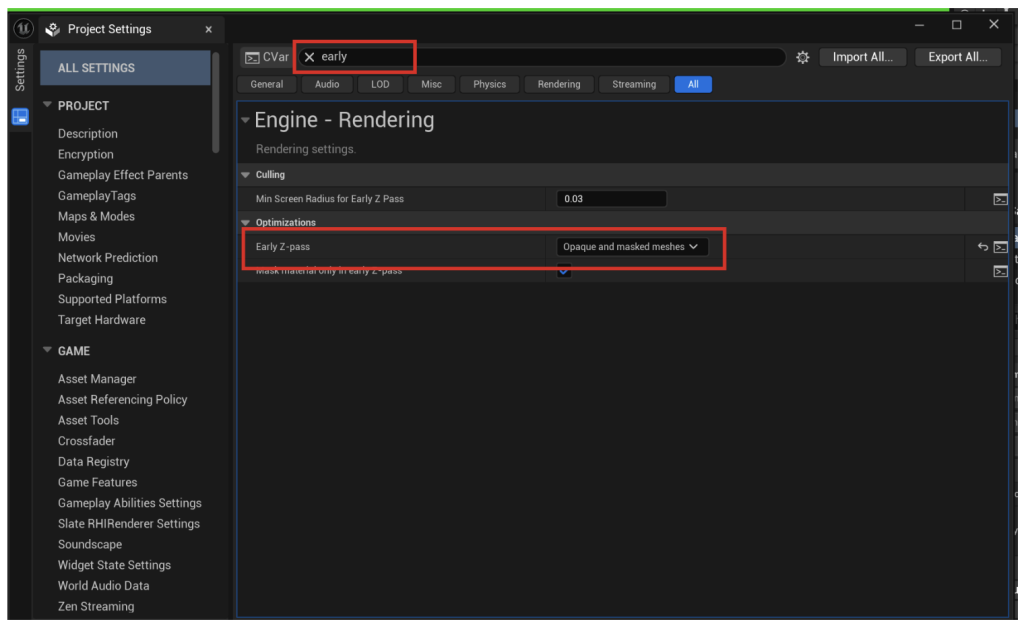
- Go to Project Settings and set Early Z-Pass to “Opaque and Masked meshes”. This forces the GPU to depth-test and discard occluded pixels before executing expensive fragment shader logic.
- Reduce the screen-space coverage of translucent materials. For masked materials like foliage, ensure the geometry is tightly clipped to the opacity mask shape rather than using large, empty bounding boxes.
- For complex overlapping transparent objects, use Stencil buffer masks to prevent rendering layers that are effectively hidden.
Pixel Shader Efficiency
To maximize the efficiency of your material shaders:
- Open the Material Editor and click the “Stats” button in the toolbar. This shows the instruction count. Aim to keep this count low by minimizing texture lookups.
- Avoid using “If” nodes or complex branching logic in materials. These operations force the GPU to stall, as execution parallelism is broken. Use Lerp or Static Switch Parameters instead.
- Each TextureSample node adds to the sampler count limit. Pack individual grayscale maps (like Roughness, Metallic, and Ambient Occlusion) into a single RGB texture to reduce fetch operations.
- Replace expensive functions like Power, Sines, or Cosines with simpler approximations where visual fidelity allows.
5.2 Advanced Mesh Instancing (ISM, HISM, and Nanite)
Instanced Static Meshes (ISM)
High draw call counts generate substantial CPU driver and GPU state-change overhead. When a scene contains numerous identical static objects, instancing consolidates them into unified rendering packets.
- Select static mesh actors, right-click, and use the “Replace with Instanced Static Mesh” or “Merge Actors” option.
- Use the Instance Properties in the Details panel to manage instance arrays and transformation data.
- Use the “stat scene” console command to verify the reduction in draw calls.
Hierarchical Instanced Static Meshes (HISM)
- Use the Foliage Tool (Shift+3) or place an HISM component blueprint to enable per-instance culling.
- Ensure the base mesh has LODs; HISM automatically manages cross-fading transitions based on distance.
- Adjust the “Instance Start/End Cull Distance” in the HISM component settings to prevent distant instances from rendering.
Nanite
- Select the static mesh in the Content Browser, check “Enable Nanite Support” in the Details panel, and click Apply Changes.
- Use standard “Instanced Static Mesh (ISM)” components for grouping; do not use HISM, as Nanite handles its own GPU cluster culling.
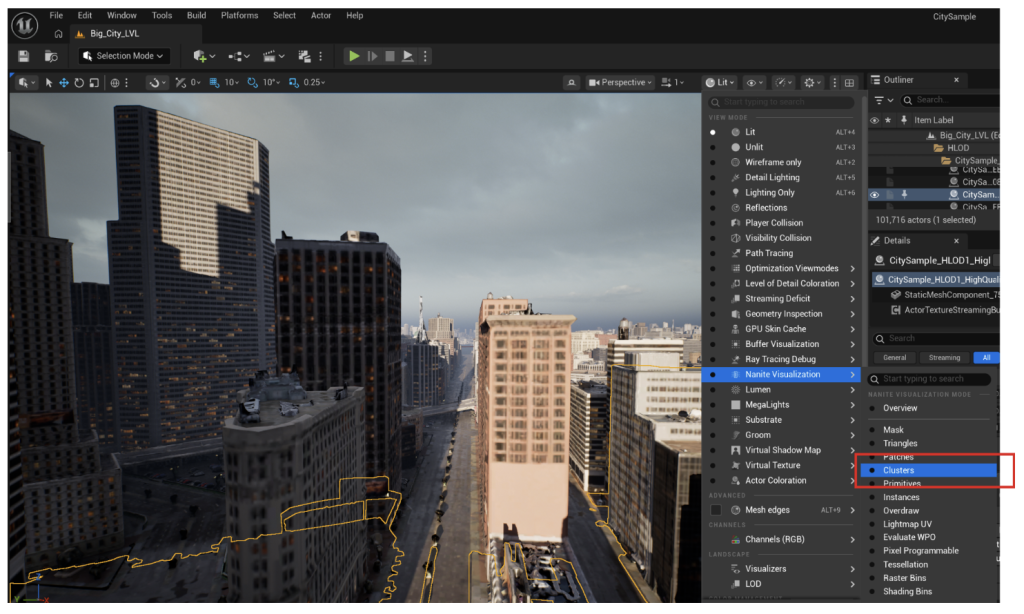
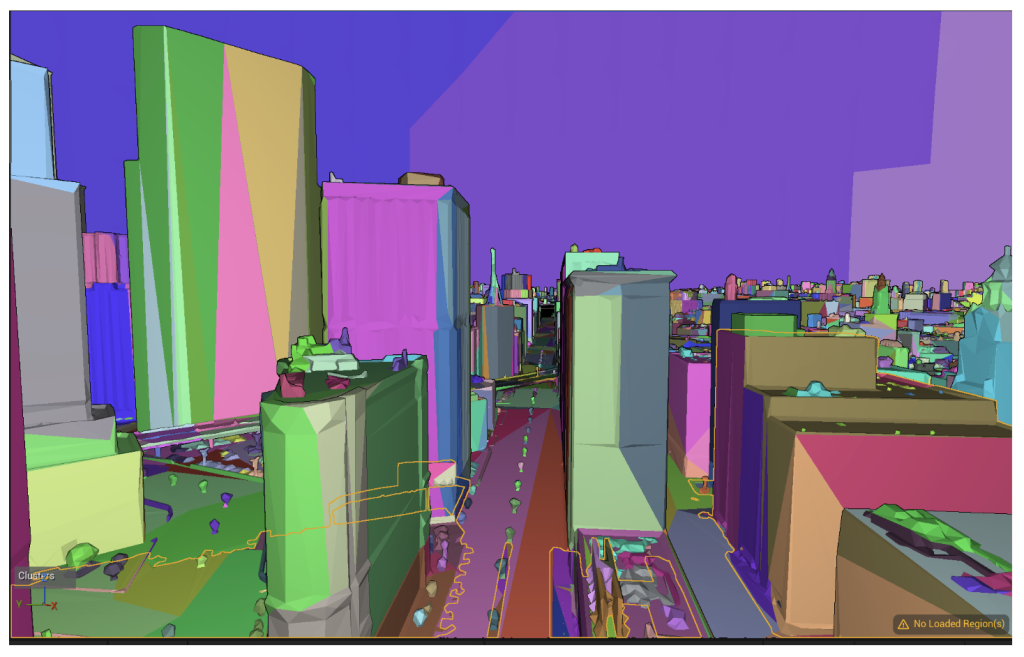
- Use “View Mode > Nanite > Clusters” to visualize density and adjust fallback mesh settings for optimal performance.
5.3 Texture and Asset Compression Settings
High-resolution and uncompressed textures rapidly saturate Video Memory (VRAM) bandwidth, a constraint magnified on platforms with unified memory (such as mobile devices and consoles).
Why does VRAM bandwidth matter?
VRAM bandwidth functions as the ‘data highway’ between your GPU’s processing cores and its memory. When this capacity is saturated, the GPU stalls while waiting for textures, render targets, and vertex buffers to load, which directly manifests as frame drops or micro-stutters. Crucially, bandwidth is a limit on throughput (data speed), not just storage capacity; even if your assets fit within your VRAM ‘pool,’ high-bandwidth demands from uncompressed 4K textures, high draw call counts, or complex alpha-blending can force the engine to delay rendering. Optimizing for bandwidth ensures the GPU remains fully utilized by preventing these data-fetch bottlenecks.
Implementation Guide: Configuring Texture Assets
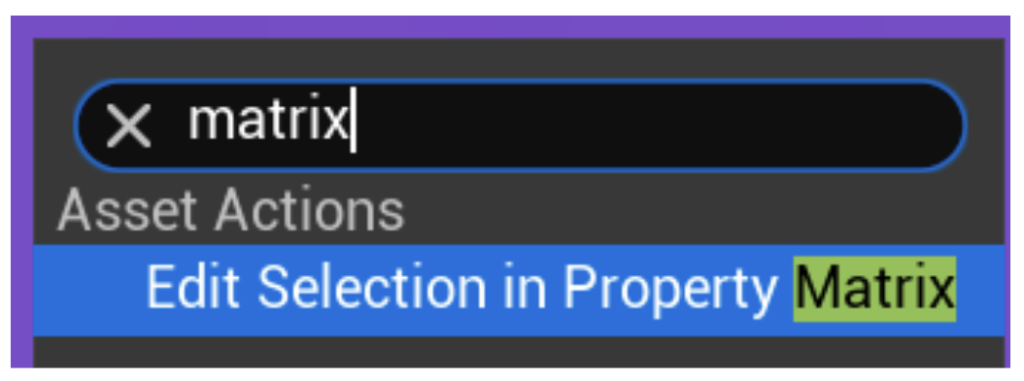
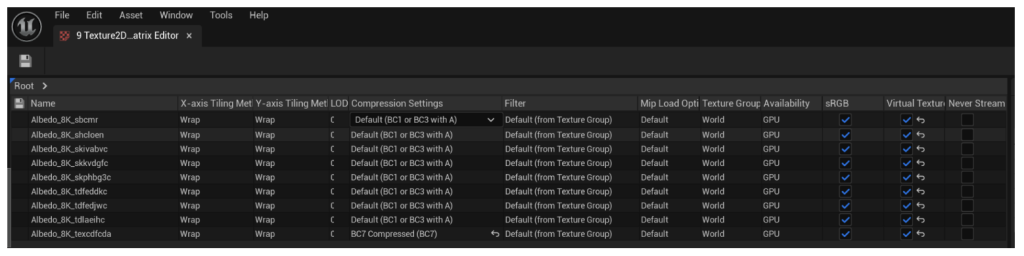
- Asset Identification: In the Content Browser, select your textures. Right-click and choose Bulk Edit via Property Matrix to adjust settings for multiple assets simultaneously.
- Set Compression Settings: For each texture, navigate to the Details panel. Set Compression Settings based on usage (e.g., BC7 for quality, BC5 for normal maps).
- Clamp Resolution: Enable Max Texture Size and set appropriate limits (e.g., 2048 for environment, 1024 for props) to prevent VRAM saturation.
- Assign Texture Groups: Set the LOD Group parameter to match the asset’s function (e.g., World, UI, Character) to ensure the engine applies correct streaming and memory pool policies.
- Review Mipmaps: Ensure Mip Gen Settings is set to FromTextureGroup to allow the engine to stream mips appropriately based on distance.
| Setting / Parameter | Optimization Effect | Best Practice Implementation |
|---|---|---|
| Compression Settings | Reduces physical texture storage size in VRAM via standard algorithms (e.g., BC1-BC7, ASTC). | Use BC7 for high-quality desktop textures, BC5 for normal maps, and ASTC (8×8 or 6×6) for mobile platforms. |
| Max Texture Size | Clamps the maximum resolution permitted at runtime without destroying source files. | Clamp minor props to 512 or 1024, secondary environment assets to 2048, and reserve 4048 strictly for landscape or hero assets. |
| LOD Bias | Offsets the highest mip level loaded, acting as an easy slider to reduce texture density globally or per-asset. | Increase LOD Bias on lower-end hardware profiles to drop resolution sizes and save immediate memory bandwidth. |
| Texture Groups | Categorizes assets to govern streaming behaviors dynamically via engine configurations. | Assign assets to correct groups like TEXTUREGROUP_World or TEXTUREGROUP_UI to control group-wide streaming pools. |
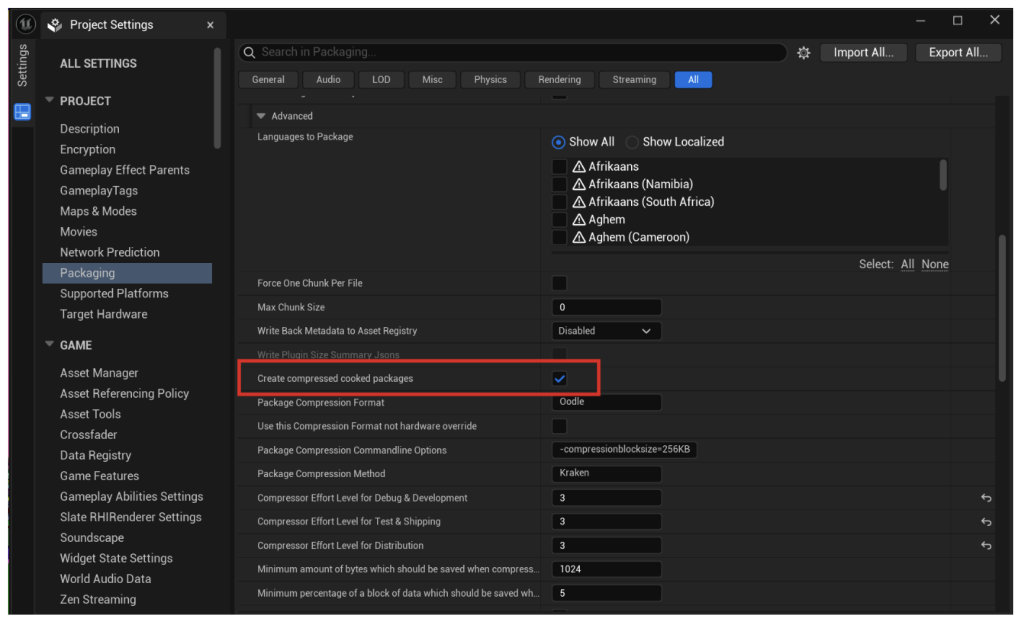
5.4 Build and Packaging Configurations
- Navigate to Project Settings > Packaging. Set the Build Configuration to Shipping to remove debug logging and profiling hooks.
- Review and disable unused tools in Edit > Plugins to reduce executable size and runtime memory footprint.
- Enable ‘Create compressed cook packages’ and ensure the Event Driven Loader (EDL) is active to refine asset serialization.
5.5 Optimizing Heavy Shaders and Complex Materials
- Use Master Materials combined with Material Instances to maintain shader state integrity and prevent costly state changes.
- Restrict dynamic “If” nodes to avoid hardware stalls. Prioritize linear math over branching logic to preserve parallelism.
- Utilize the Material Analyzer to eliminate redundant texture samplers and manage masked blend modes efficiently.
The Material Editor compiles node networks into complex HLSL code executed per pixel. Material structural inefficiencies can drastically expand fragment shader instruction counts, triggering severe rendering latency.
5.6 Other Performance Tuning and Workflow Optimization
To guarantee thoroughness and ensure smooth performance across all target hardware levels, developers must monitor lighting subsystems and implement global workflow strategies:
- Audit Virtual Shadow Maps (VSM) costs. Swap to Cascaded Shadow Maps (CSM) on lower-tier targets to regain frame budget.
- Downsample volumetric render resolutions or increase ray-march step sizes to lower the heavy computational load of 3D textures.
- Avoid uncapped planar reflections; utilize Screen Space Reflections (SSR) or baked reflection captures instead.
- Minimize complex math in post-process materials to prevent increased GPU latency on the final output buffer.
- Record PSO data during playthroughs and build the cache into your final distribution to prevent mid-game compilation stutters.
- Define quality tiers in DefaultScalability.ini. Adjust Resolution Scaling and shadow methods to meet the specific performance budgets of diverse hardware.
6. Conclusion
Developing with Unreal Engine 5 requires a sophisticated balance between creative freedom and technical discipline. As we move into an era of film-quality real-time rendering, the margin for inefficiency shrinks. By deeply understanding the rendering pipeline—from the initial CPU draw call preparation to the final rasterization on the GPU—and leveraging external profilers like RenderDoc, you can transform performance optimization from a reactive “firefighting” process into a proactive design methodology.
The strategies outlined, including Virtual Texturing for bandwidth management, Instancing for geometry throughput, and PSO Caching to eliminate runtime hitches, provide a robust framework for stabilizing frame rates. Ultimately, systematic reduction of GPU state changes and efficient video memory management ensure that your project remains accessible and runs smoothly across diverse hardware tiers, from entry-level mobile devices to high-end workstations. Success in UE5 is not just about utilizing the latest features like Nanite and Lumen, but about mastering the tools that allow those features to thrive within a constrained performance budget.
7. References
- https://dev.epicgames.com/community/learning/tutorials/rp92/unreal-engine-unpacking-ue5-toolbox-part-1-nanite
- https://dev.epicgames.com/documentation/unreal-engine/using-renderdoc-with-unreal-engine
- https://dev.epicgames.com/documentation/unreal-engine/runtime-virtual-texturing-in-unreal-engine
- https://dev.epicgames.com/documentation/unreal-engine/instanced-static-mesh-component-in-unreal-engine
- https://dev.epicgames.com/documentation/unreal-engine/optimizing-rendering-with-pso-caches-in-unreal-engine
- https://dev.epicgames.com/documentation/unreal-engine/scalability-reference-for-unreal-engine
- https://dev.epicgames.com/documentation/unreal-engine/testing-and-optimizing-your-content
- https://unrealartoptimization.github.io/book/profiling/passes/
- https://dev.epicgames.com/documentation/unreal-engine/nanite-virtualized-geometry-in-unreal-engine
- https://jaredp94.github.io/Unreal-Development-Guides-and-Tips/Content/DevPipelines/Textures.html
- https://dev.epicgames.com/documentation/en-us/unreal-engine/virtual-texturing-reference?application_version=4.27
- https://dev.epicgames.com/documentation/unreal-engine/API/Runtime/Engine/EEarlyZPass__Type
- https://developers.meta.com/horizon/documentation/unreal/unreal-debug-android/